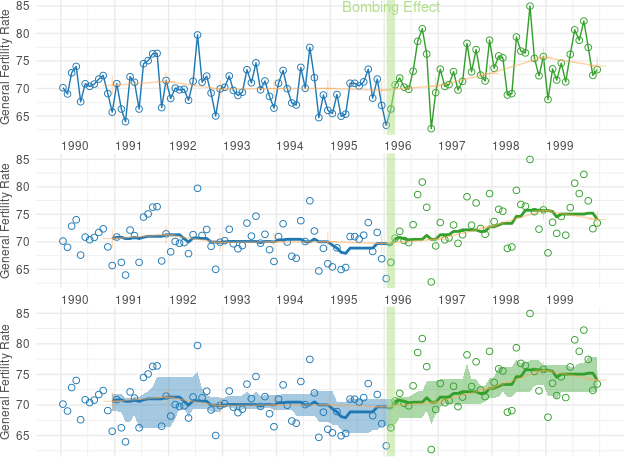
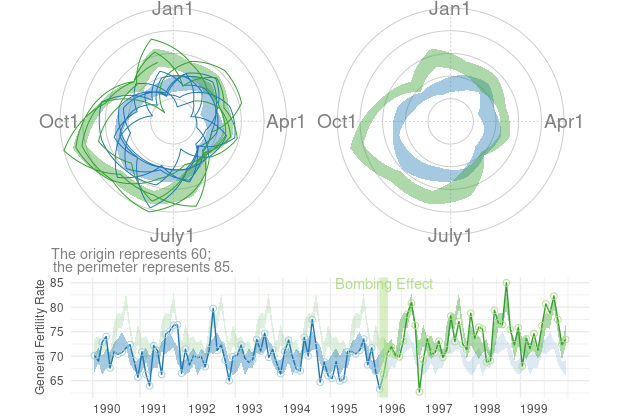
Welcome to the Wats Package. This implements the approaches described in Joseph Lee Rodgers, William Howard Beasley, and Matthew Schuelke (2014). Wrap-around Time Series Plots (WATS Plots) for Interrupted Time Series Designs: Applications to Fertility Rates and the Oklahoma City Bombing. Multivariate Behavioral Research.
The figures can be viewed in the vignettes, or in the Handouts document. The release version of Wats is available on CRAN.
Article Abstract
Many data structures, particular time series data, are naturally seasonal, cyclical, or otherwise circular. Past graphical methods for time series have focused on linear plots. In this paper, we move graphical analysis onto the circle. We focus on two methods, one old and one new. Rose diagrams are circular histograms, and can be produced in several different forms using the RRose software system. In addition, we propose, develop, and illustrate a new circular graphical method, called Wrap-Around Time Series Plots (WATS plots) that is useful to support time series analyses in general, but in particular in relation to interrupted time series designs. We illustrate the use of WATS Plots from an interrupted time series design evaluating the effect of the Oklahoma City bombing on birth rates in Oklahoma County during the ten years surrounding the bombing of the Murrah Building in Oklahoma City. We compare WATS Plots to linear time series representations with smoothing. Each method is shown to have advantages in relation to the other; in our example, the WATS Plots more clearly show the existence and effect size of the fertility differential.
Keywords: time series, interrupted time series design, group differences, graphical analysis, circular data, H-spread
Reproducible Research
When the Wats package is installed on your local machine, the reproduce.R script starts with our initial datasets (i.e., the vital statistics birth counts and the US Census population estimates) to create the derivative datasets and resulting graphs and analysis.
Nonstandard Directories
The following directories are not part of the standard R package:
-
datasets/: CSV versions of the *.rda data frames officially included in the package. The incoming/unprocessed files are stored indatasets/raw/. The processed files are stored indatasets/derived/. -
documentation-for-developers/: Notes and links that should help package developers set up on their computer. Typical package users won’t have a need for this. -
publication-graphs/: A deprecated location that contains loose graphs of older versions of the manuscript. -
playgrounds/: R snippets to help developers experiment with potential new features. -
utility/: R scripts that aren’t incorporated into the package. They help automate certain tasks, or document how parts of the package were created.
Installing
The released CRAN version of Wats can be installed through R with.
install.packages("Wats")The latest development version of Wats can be installed from GitHub after installing the remotes package.
install.packages("remotes")
remotes::install_github("OuhscBbmc/Wats")
Code Repository
The software is written primarily in R, under the MIT License. The DOI of this major release of the repository is 10.5281/zenodo.11921. (The DOI of the article is 10.1080/00273171.2014.946589.)
Funding
Continued development and maintenance of this package supported by the Oklahoma Shared Clinical and Translational Resources (OSCTR, U54GM104938) with an Institutional Development Award (IDeA) from NIGMS. The content is solely the responsibility of the authors and does not necessarily represent the official views of the National Institutes of Health.
Build Status and Package Characteristics
| Branch | GitHub Actions | Codecov |
|---|---|---|
| Main | ||
| Dev | ||
| Ubuntu Latest | Test Coverage |
| Key | Value |
|---|---|
| License |  |
| CRAN Version | |
| CRAN Rate | |
| Zenodo Archive | |
| Production Doc | |
| Development Doc |  |

